7 Simple Steps of Data Analysis for Beginners
Are you curious about data analysis but not sure where to start? You’re not alone. Many people want to understand data but feel overwhelmed by complex terms and tools. The good news? You can start with just seven simple steps.
In this guide, we’ll walk through the steps of data analysis using clear and simple language, no technical background required.
Step 1: Ask the Right Question
Before touching any data, ask yourself:
“What do I want to find out?”
Examples:
- Why are sales dropping in certain months?
- What’s the most popular product this year?
- Which age group attends our workshops the most?
Having a clear question gives your work direction and purpose.

Step 2: Collect the Data
Now that you know your question, you need data. This could be:
- A spreadsheet from your business
- Survey responses
- Website traffic reports
If you don’t have data, you may need to create a survey or find public datasets online.

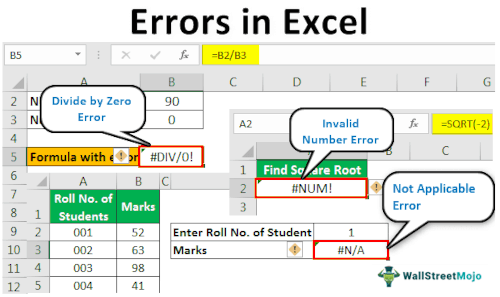
Step 3: Clean the Data
Raw data is often messy. You might find:
- Typos
- Empty cells
- Duplicate entries
Cleaning the data means fixing these problems. You can use Excel tools like Find & Replace, Remove Duplicates, or Text to Columns.
Step 4: Explore the Data
This is where things get fun!
Look through your data to spot:
- Trends
- Patterns
- Unusual numbers
In Excel, you can use sort, filter, and pivot tables to dig deeper.
Example:
You might discover that sales are always highest in December.

Step 5: Analyze the Data
Now, look at your findings and ask:
“What do the numbers say about my question?”
You don’t need complex math. Just basic comparisons like:
- Are sales higher for Product A or Product B?
- Which days have the most website visitors?
This step is about understanding the data, not just looking at it.

Step 6: Interpret the Results
This step is about meaning. Ask:
“What do these results mean for me or my organization?”
For example:
- If most customers buy in December, maybe you need a big holiday campaign.
- If one product is underperforming, it may need better promotion.

Step 7: Share Your Findings
Don’t keep your findings to yourself. Make it simple for others to understand. Use:
- Charts
- Bullet points
- Clear language
You can use Excel to create visual summaries or even a basic dashboard.

The steps of data analysis don’t have to be hard. With a clear question and some practice in Excel, anyone can begin to make sense of data. Start small, take it one step at a time, and don’t worry about being perfect.