SPSS Descriptive Statistics: A Beginner’s Guide
When you first collect data, whether from a survey, experiment, or project, the next step is usually to understand what it’s telling you. That’s where descriptive statistics come in.
SPSS makes this process fast and easy, even for beginners. In this post, we’ll show you how to summarize your data using SPSS in just a few minutes.
What Are Descriptive Statistics?
Descriptive statistics help you understand your data at a glance. They show you things like:
- The average (mean) score
- The most common (mode) answer
- The middle value (median)
- How spread out the data is (standard deviation)
- The lowest and highest values (minimum and maximum)
These statistics are helpful when you’re just starting your analysis or preparing a report.
Step 1: Open Your Data in SPSS
If you already have data in Excel, you can easily open it in SPSS
Select file and then click “OK”:
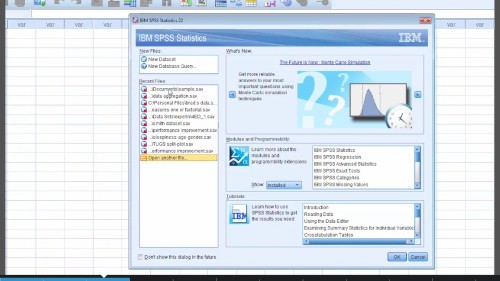
File opens:
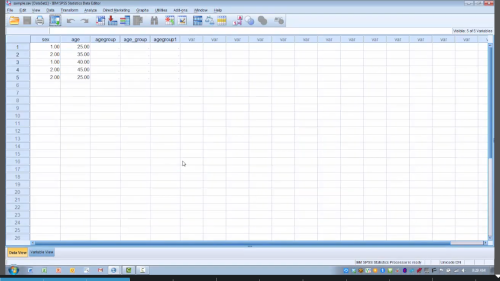
Once your data is open, make sure your columns (variables) are correctly labeled. Each column should have a name like “Age”, “Score”, or “Gender”, and each row should be a different person or observation.
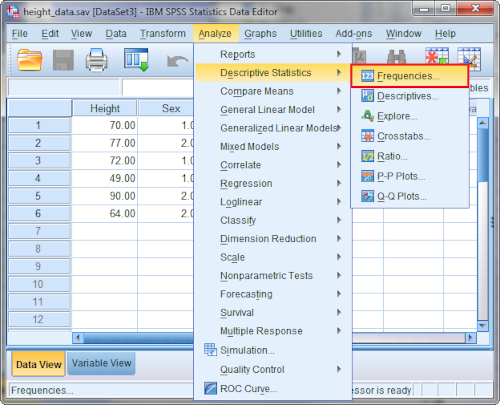
Step 2: Go to the Descriptive Statistics Menu
- Click “Analyze” in the top menu.
- Hover over “Descriptive Statistics”.
- Click on “Frequencies” or “Descriptives”.
Use “Frequencies” for categorical data like gender or responses such as “Yes” or “No”.
Use “Descriptives” for numeric data like age, height, or test scores.
Step 3: Select the Variables You Want to Analyze
A box will appear with all your variable names on the left. Select the variables you want and click the arrow to move them to the right.
Step 4: Choose the Statistics You Want
Click the “Statistics” button to choose what you want SPSS to calculate:
- Mean
- Median
- Mode
- Standard deviation
- Minimum and Maximum
- Range
Tick the boxes for the values you’re interested in, then click Continue.
Step 5: View and Understand Your Output
Click OK, and SPSS will give you a table with the statistics for each variable.
Let’s break down what the output might show:
| Variable | N | Mean | Median | Mode | Std. Deviation | Minimum | Maximum |
|---|---|---|---|---|---|---|---|
| Age | 50 | 25.4 | 24 | 22 | 3.2 | 20 | 31 |
- N is the number of people or responses.
- Mean is the average.
- Median is the middle number.
- Mode is the most frequent number.
- Standard Deviation tells you how spread out the responses are.
- Min/Max show the range of values.
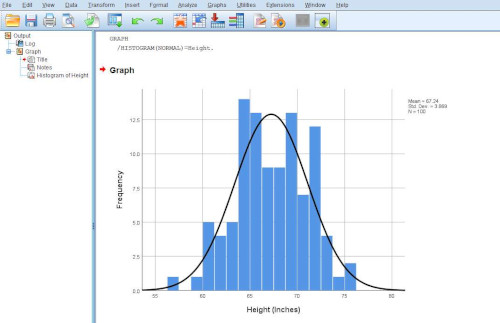
Step 6: Create Charts for Better Understanding
If you’re using Frequencies, SPSS can also create bar charts or histograms for you.
- In the Frequencies dialog box, click “Charts”
- Choose the type of chart you want (e.g., bar chart or histogram)
- Click Continue, then OK
When to Use Descriptive Statistics
Use descriptive statistics when you want to:
- Get a quick overview of your data
- Check for any major errors or outliers
- Compare different groups (e.g., males vs. females)
- Prepare summaries for reports or presentations
Tips for Beginners
- Always check that your data is clean before running any analysis.
- Use value labels to make your results easier to read (e.g., show “Male” instead of “1”).
- Don’t overcomplicate it. Start with just mean, min, and max and build from there.